After the worst market week since the 2008 financial crisis, and one of the worst months since the 1930s, the market finished out a remarkably bad series of negative returns this past quarter, including consecutive days of 1,000 point drops in the Dow and a February 1-month drop of 7.5% in the S&P 500 index. And then there have been significant gains in recent weeks.
Dramatic stock market movements in a short time-frame can be unnerving and cause for concern. Part of our role as investment advisors is to try to absorb the worst of client fears, in order to still make prudent decisions, especially in times of panic.
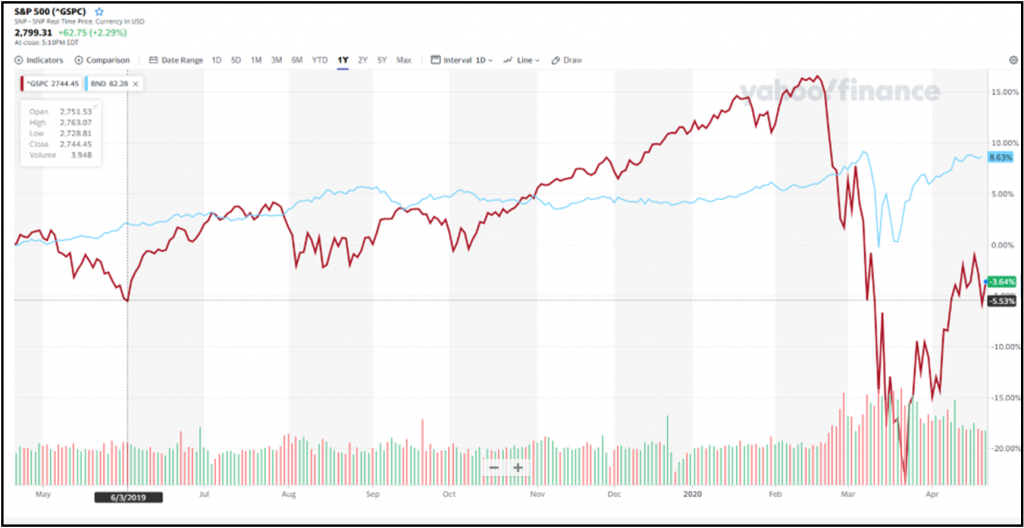
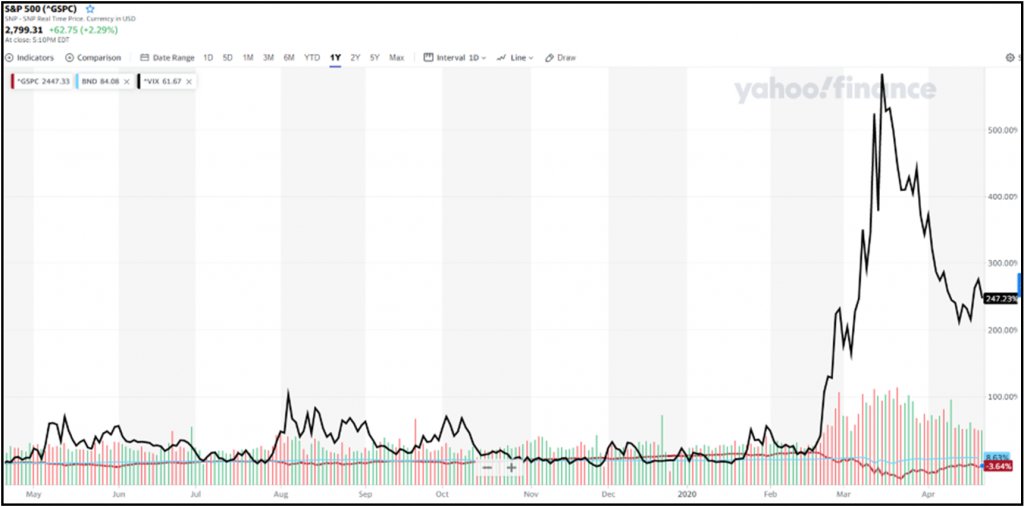
One of the key indicators of volatility that we watch is the Chicago Board Options Exchange’s CBOE Volatility Index, VIX, nicknamed the “Fear Index”. Below is a snapshot of the 1yr Trailing returns for the S&P 500 vs BND Bond Index. Below that is the same graph but with the VIX index added (the black line).
As you can see, we are still in a period of abnormally high volatility. Please do not hesitate to reach out with questions, comments, concerns, or anything else on your mind.